Handbook |
Search Handbook
|
Managing Data
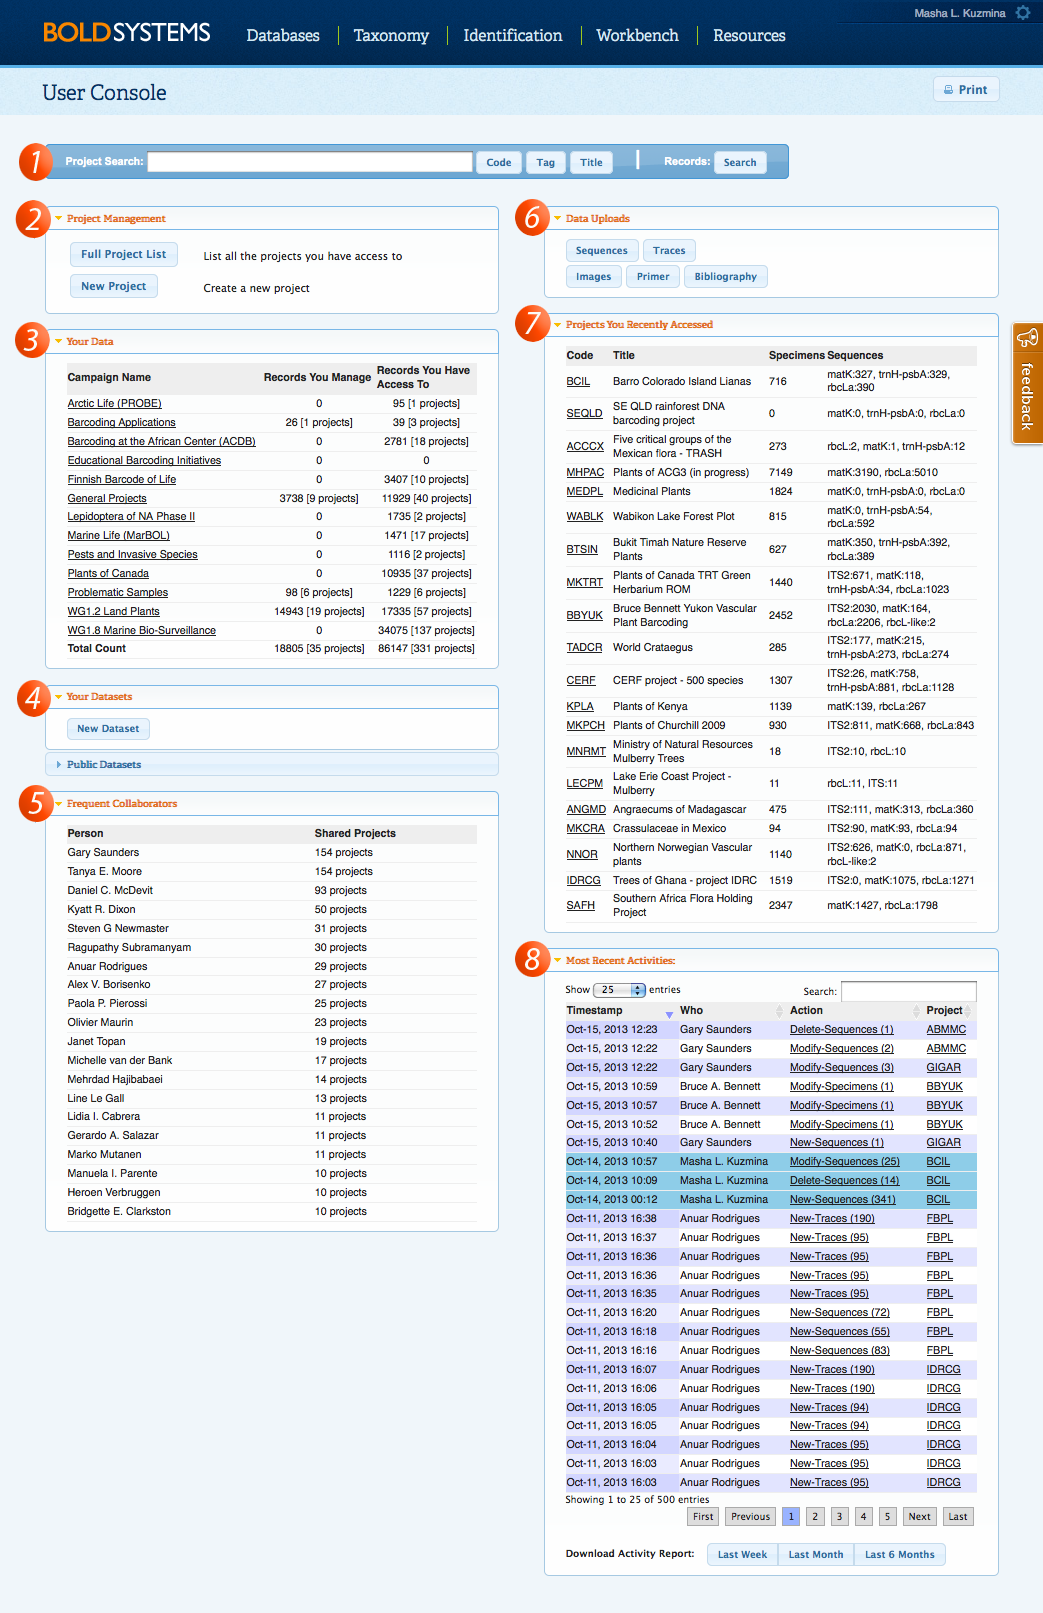
User ConsoleThe User Console is BOLD's landing page when users log in. This console provides a quick overview of the user data management activities. Features available in this console include rapid access to frequently visited projects, reports on project activity, as well as powerful and improved search tools. Users can rapidly view activities associated with their projects through the real-time Activity Report and quickly navigate to recently accessed projects in the Projects You Recently Accessed box, which automatically updates when the User Console is opened. Users can also view and create new datasets right from this console. Both the user's private datasets and all the public ones are visible. Public datasets are sorted by the dataset managers, so users can easily find a set of data by scanning the list of contributors. Upload options are also provided here, so there is no need to open a specific project to upload images, trace files, or sequences. The system will match the Sample and Process IDs in the upload file and add the data to the correct records. New primers and publications can also be registered to the system from this console. These shortcuts allow users to upload data across multiple projects simultaneously. New Integrated Search BarThe newest version of BOLD introduces an integrated search bar accessible from the User Console , Project Console, and Project List. Users no longer have to go back to the User Console to search for records, projects codes, tags, or titles on BOLD. By selecting the Record Search from the Project Console and Record List , users now have the ability to choose if they want to search records within the project or within BOLD. For more information on the new search capabilities, click here.
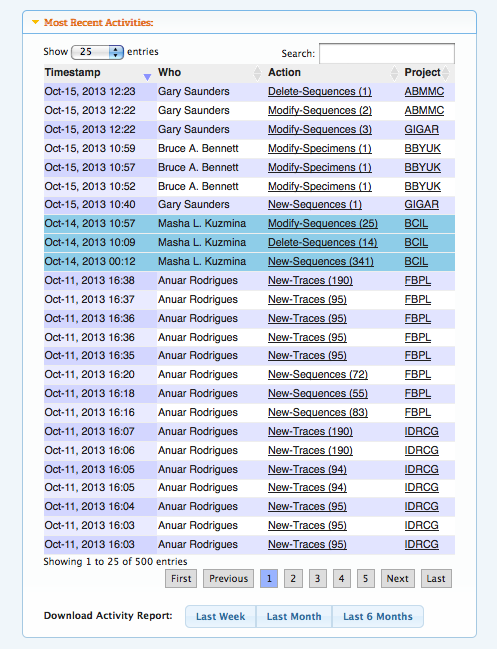
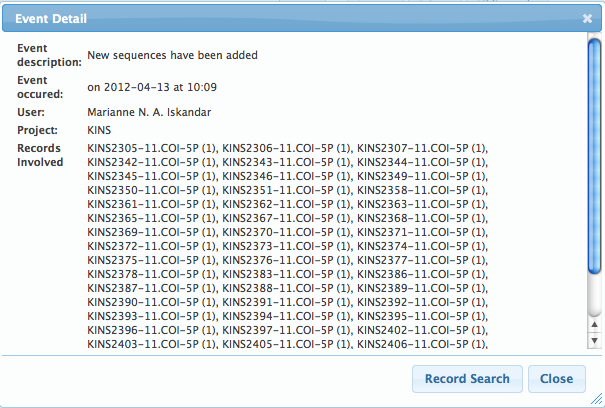
Real-time Activity ReportingThe Activity Report can be viewed from the User Console and the Project Console, it logs all the activities pertinent to the user and project, respectively. This tool is very useful in keeping track of collaborative work, as users will be able to view the list of changes being made to their records. The activity report will log the addition of new specimens, images, traces, and sequences to the system, updates to specimen information, sequence deletions, and insertions of GenBank accessions. In addition, new tags, flags, and comments are also recorded, so project managers can quickly stay informed of the actions taken in their projects. Logs can be downloaded, allowing users to keep personal records and perform additional analysis.
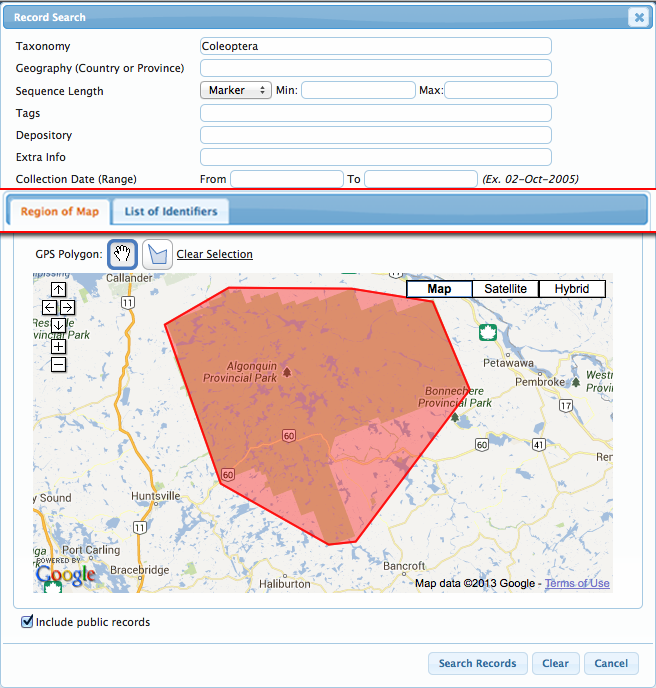
Back to Top Searching the WorkbenchThe newest version of BOLD introduces an integrated search bar accessible from the User Console , Project Console, and Project List. Users no longer have to go back to the User Console to search for records, projects codes, tags, or titles on BOLD. By selecting the Record Search from the Project Console or Record List , users now have the ability to choose if they want to search records within the project or within BOLD. To search within BOLD, users simply check off the box to "Search within the Project", and will be able to conduct BOLD-wide searches. The search form allows users to perform searches based on many parameters. These parameters can be used simultaneously to get an intersection of records (i.e., searching a taxon and a list of Sample IDs will return only the records matching both).
*Notes on use of the Workbench record search:
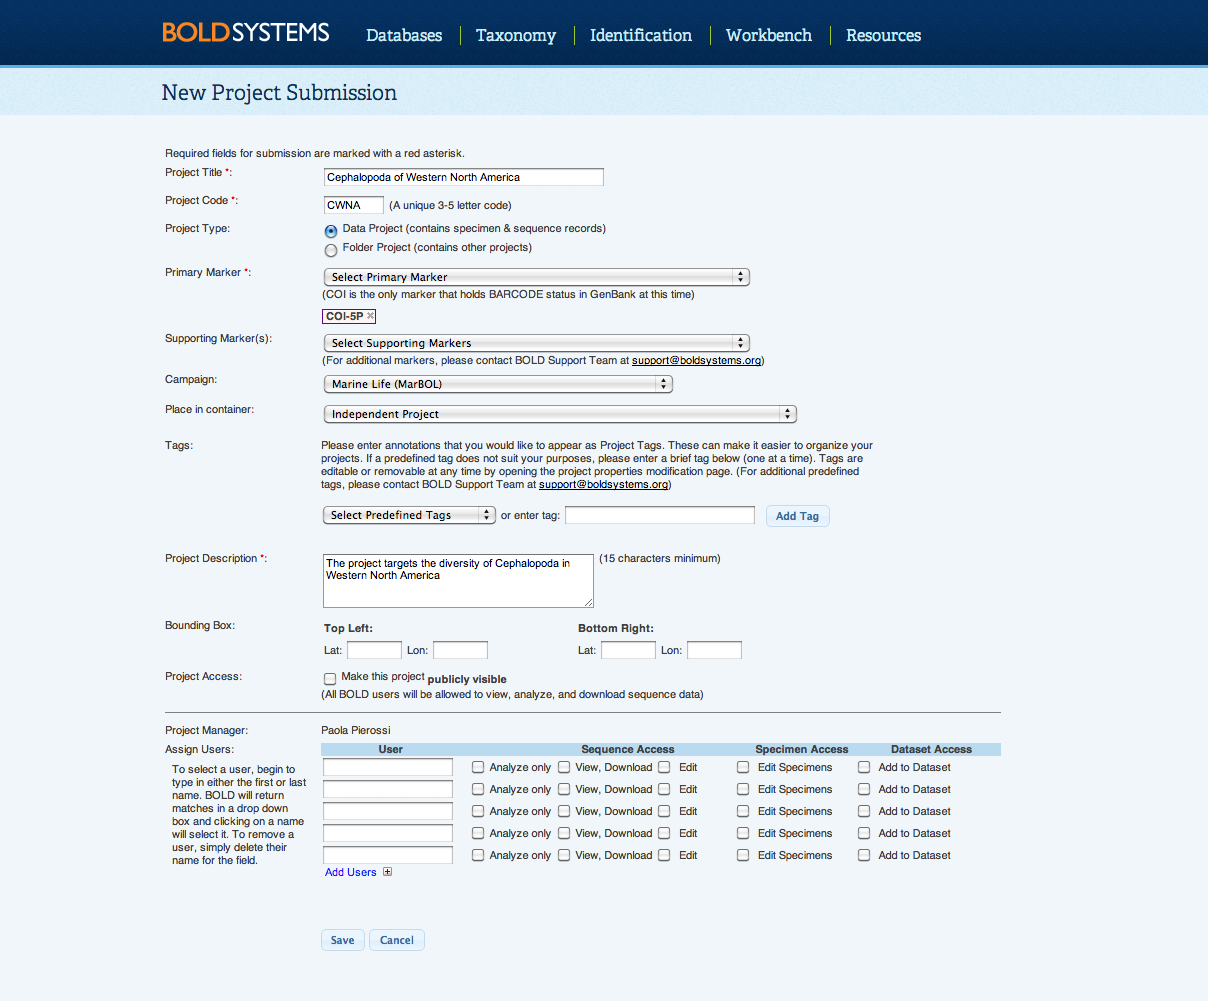
Back to Top Create a ProjectOnce logged into BOLD, select Create New Project in the User Console. This opens the New Project Submission form that will need to be filled in with the appropriate information, to create a new project. Details on the information needed to create a project are presented below. After a project is created, the Project Manager can modify the project properties and user permissions at any time by clicking on Modify Project Properties from within the Project Console. Only Project Code and Project Type cannot be changed after the project is created. With the addition of datasets, BOLD has created a new type of permission to give project managers more control over the level of access users have in their projects. To allow users to add records datasets, project managers will need to ensure the "Add to Dataset" permission box is checked in.
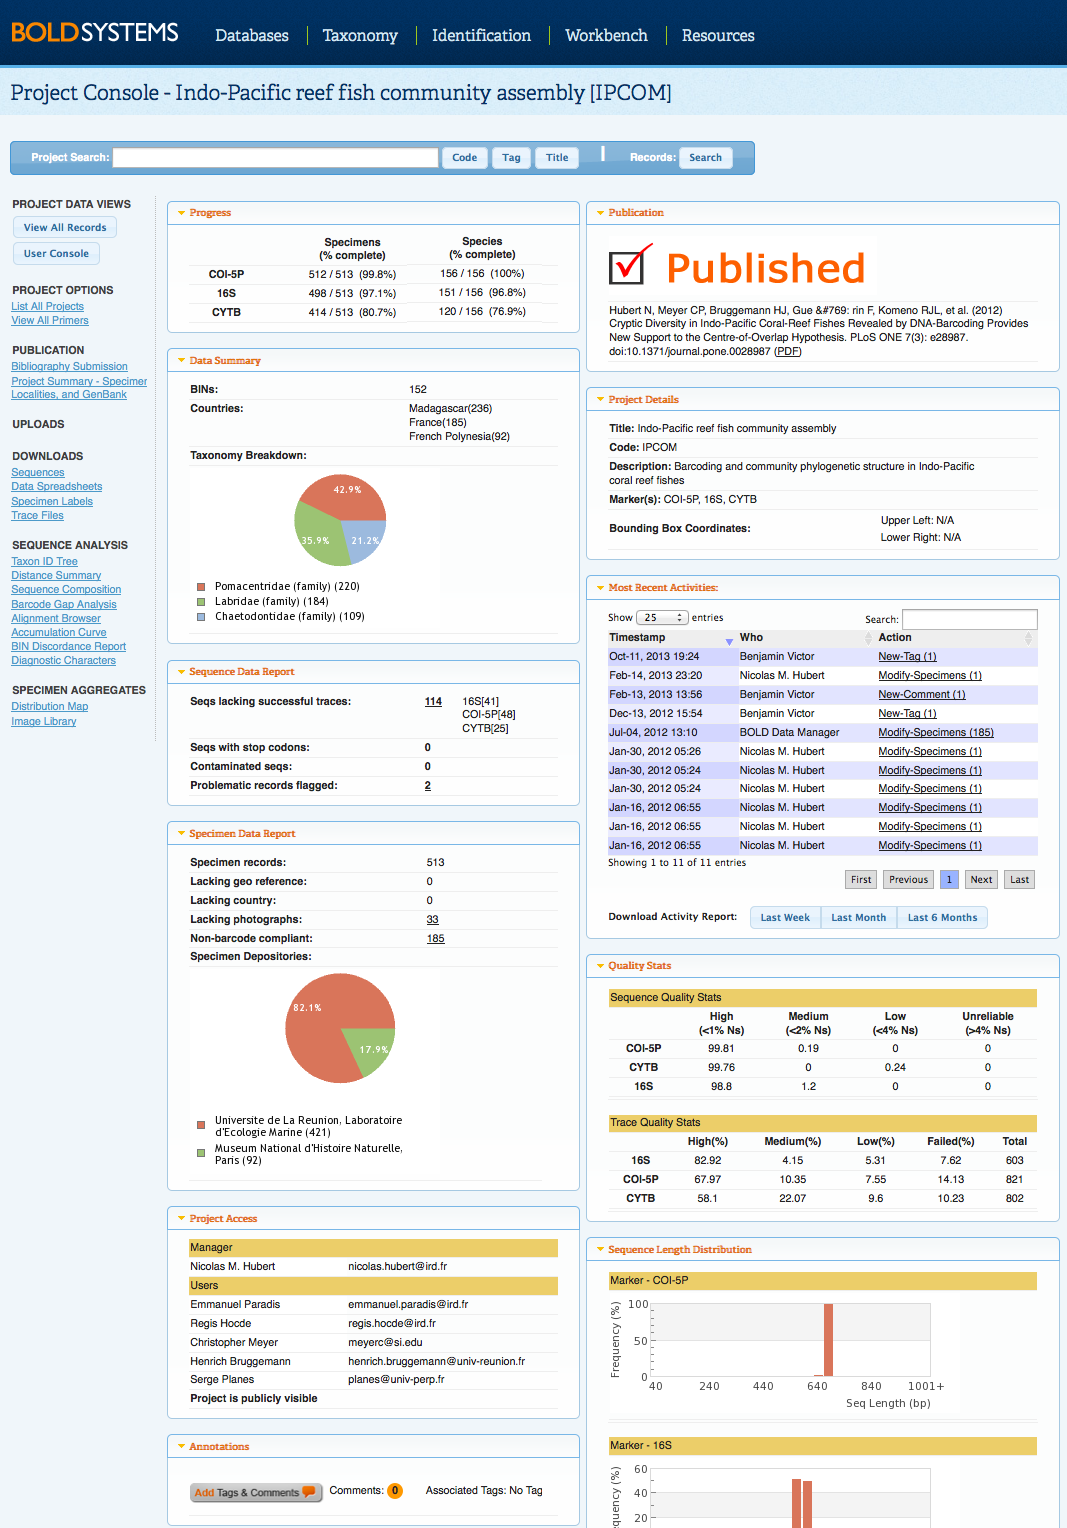
Back to Top Project ConsoleThe Project Console presents the status of records in the project as well as an audit trail of the activities being performed. This console includes an overview of the number of specimens and sequences, counts of missing components in the records, a breakdown of the specimen depositories, and a list users, with their emails, who have access to the project. Most of the information in the Project Console will be available to all users of the project, but access to certain tools will be determined by the level of permission granted by the project managers to specific users. Visit the Create New Project for more information on access permission. Only project managers will have access to the Submit to GenBank and Modify Project Properties tools. Submit to GenBank allow project managers to send the records directly from the BOLD project to GenBank. Please click on GenBank and BOLD Public data submissions for more information on publishing records to GenBank. Modify Project Properties allow project managers to update the project title and description, add supplementary genetic markers and tags to the project, and add and remove users. To view all records in the project, users can select View All Records. Alternatively, a subset of the project records can be searched using the Record Search menu at the top of the page. New Integrated Search BarThe newest version of BOLD introduces an integrated search bar accessible from the User Console , Project Console, and Project List. Users no longer have to go back to the User Console to search for records, projects codes, tags, or titles on BOLD. By selecting the Record Search from the Project Console and Record List , users now have the ability to choose if they want to search records within the project or within BOLD. For more information on the new search capabilities, click here.
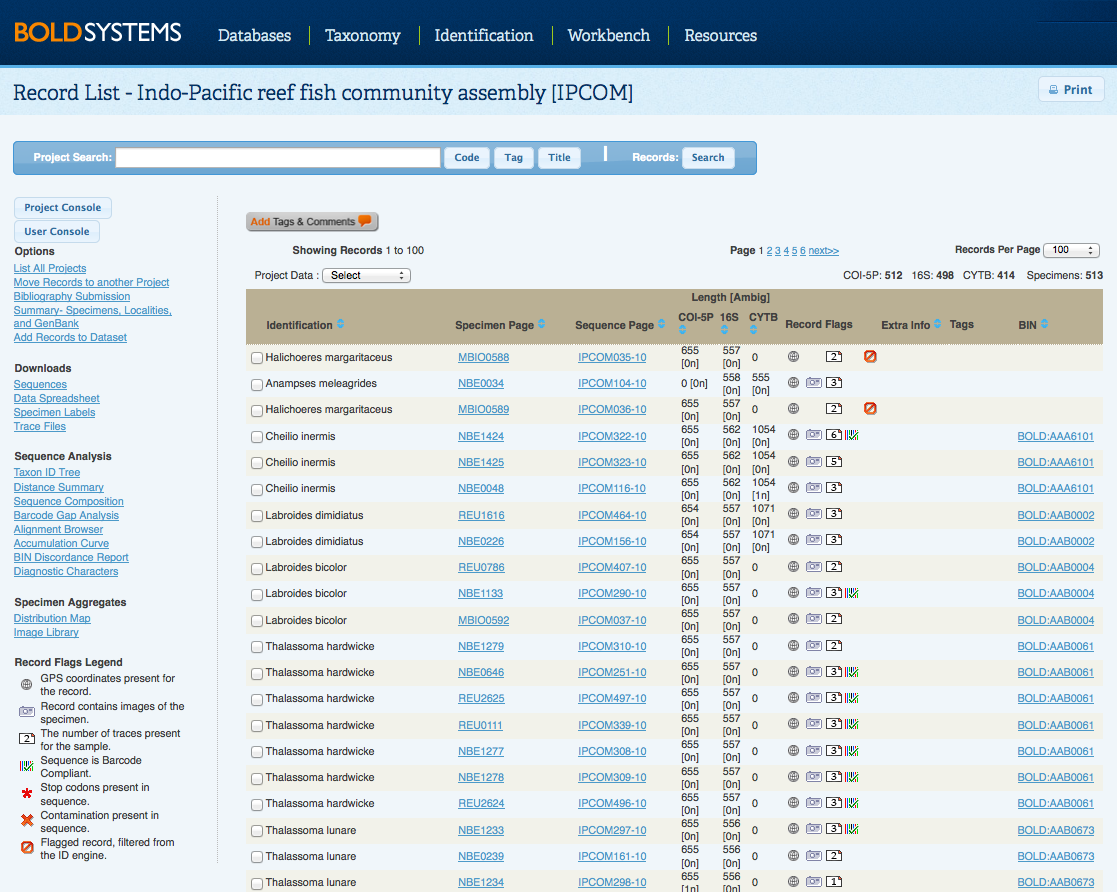
Back to Top Record ListTo access the Record List, click on View All Records in the Project Console or use the Record Search to find a set of records. The Record List provides access to the specimen and sequence data for each record, it also displays the sequence length for the record, any important "extra information" about the record submitted by the user and the code for the BINs associated with each record. Select specific records to analyze or download using the checkboxes beside the records on the left hand side. Ascending and Descending sortingBOLD now offers the ability to sort Identification, Specimen Page, Sequence Page, Markers, Extra Info, and BINs in ascending or descending order. Click on the "up" or "down" arrows of the column of choice to reorganize the list. Select Sample ID under the Specimen Page or Process IDs under the Sequence Page to access the Specimen Data and Sequence Data for each record, respectively. Once the Record List is opened, users can choose the number of records they would like to see on the record list, by selecting from the menu in the upper right corner of the page. New Integrated Search BarThe newest version of BOLD introduces an integrated search bar accessible from the User Console , Project Console, and Project List. Users no longer have to go back to the User Console to search for records, projects codes, tags, or titles on BOLD. By selecting the Record Search from the Project Console and Record List , users now have the ability to choose if they want to search records within the project or within BOLD. For more information on the new search capabilities, click here. Home Projects in the Project ListA new feature on BOLD v3.6 is the Home Project button on merged projects, and on searched record lists. Clicking on this button adds a "Project" column to the list, which shows the project codes associated to each record. The project manager or user with full editing access, can move records from one project to another by selecting the appropriate records and clicking on Move Records to another Project; or add records to a dataset by clicking on Add Records to Dataset in the left hand side menu. Flags on records:
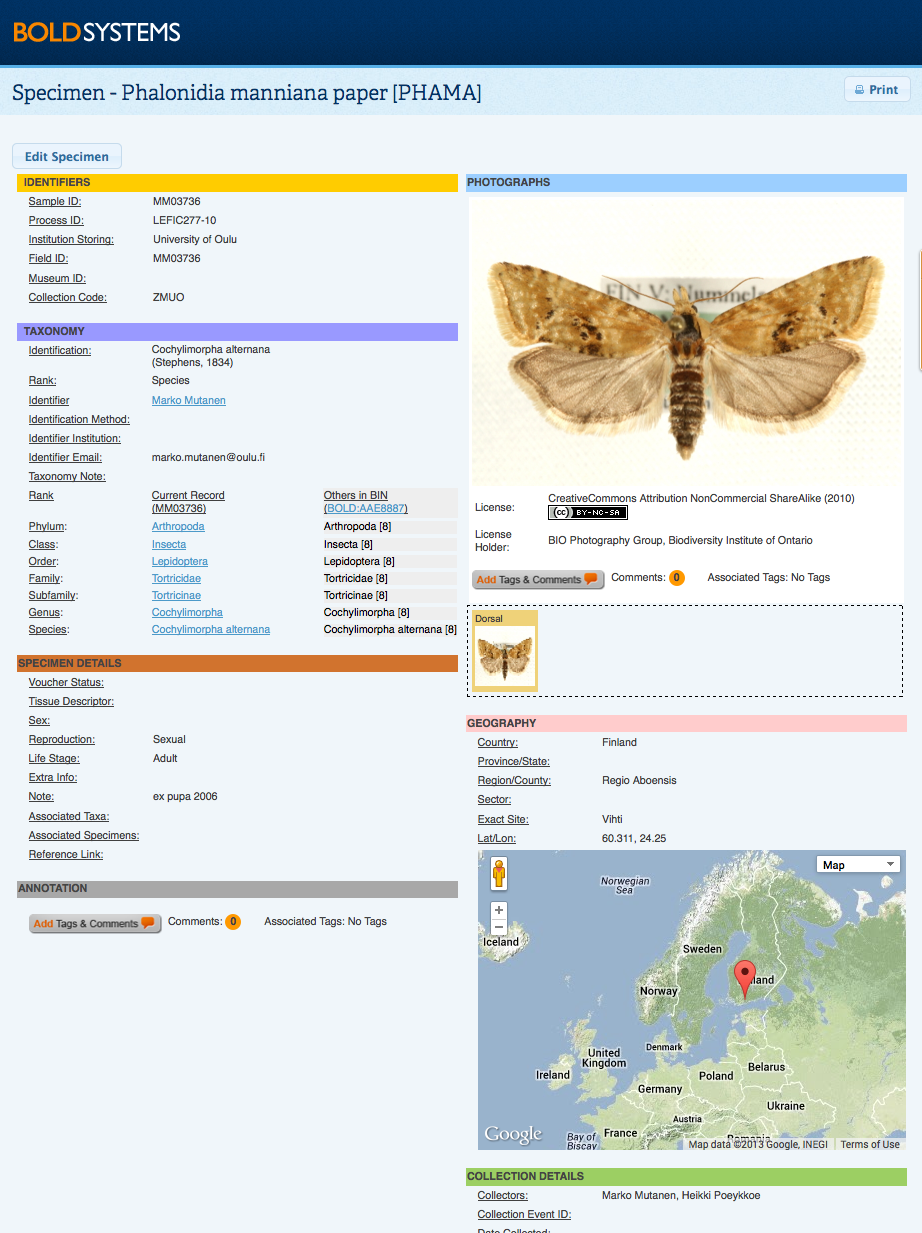
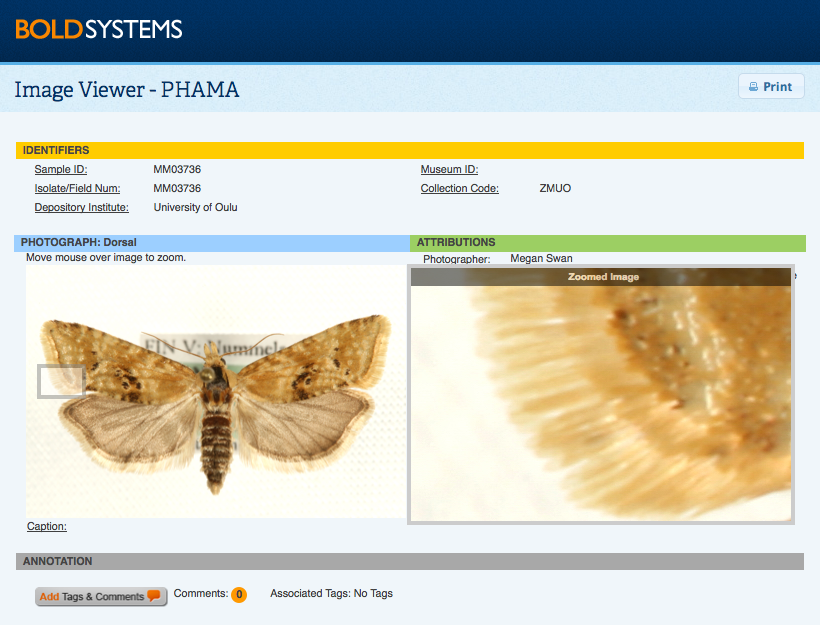
Notes on Barcode Compliance:Barcode Compliance flags on BOLD are now applied to plant barcode markers - MatK, RbcL, RbcLa, trnH-psbA; and fungi barcode markers - COI, ITS, and ITS2 with the same standards used on animal COI sequences. These standards include a minimum sequence length of 500bp, less than 1% ambiguous bases, the presence of two trace files, a minimum of low trace quality status, and the presence of a country specification in the record as set out by the Consortium for DNA Barcoding (CBOL). Back to Top Specimen and Sequence PagesSpecimen PageThis window is opened by clicking on a Sample ID in the Record List. It highlights voucher information, taxonomy, collection data, and specimen details about the record. If a record has a BIN assignment, there will be a link to the specific BIN Page within the taxonomic section of the record. Specimen information can be edited by selecting Edit Specimen from the upper right corner of the screen. This button will only be visible to users who have editing access to the specimens. An interactive Google map is also available. In this map users may zoom in to the exact collection site and, where available, select the street view of the area. This feature can be useful to gain an idea of the habitat conditions at the collection site. Collection locations are displayed on the map based on GPS coordinates only when these are provided in the submission. Comments and Annotation can be added to the Specimen Page in different forms. There are two buttons available on the form to add a tag or a comment to the record. Comments or tags will be displayed for the whole record, or just for the image. By selecting the Add Tags and Comments button, users may choose to use one for the pre-created tags, create a new tag, or add a personal comment. More information on how and why annotate a record can be found here.
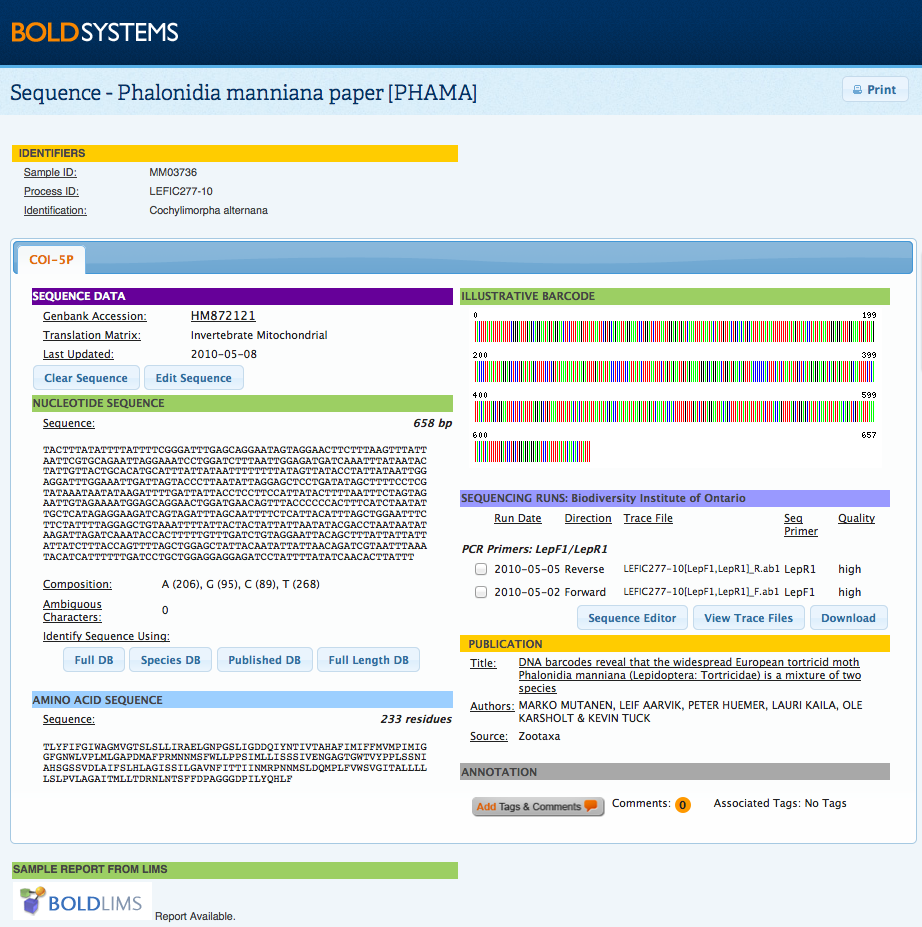
By clicking on the main image, users will open a zoomable copy. This larger image is useful for a more extensive taxonomic examination of the specimen, by being able to zoom in to different parts of the organisms users can identify morphological features which may not be clear at the image's original size. This window will also display the licensing and attribution details for the image, including the email address of the license holder for those who may be interested in using the image. Sequence PageThe sequence page is opened by clicking on a Process ID from the Record List for users with sequence viewing permission. This page provides details on the trace file(s) and sequence(s) for the specimen. Where multiple markers were sequenced for the same specimen, individual sequence information can be accessed by using the tabs at the top of the screen. Sequence details include a sequence overview, the nucleotide and amino acid sequence, and an illustrative barcode. Users are able to automatically run an identification request using the BOLD ID Engine by selecting on of the 4 databases available: Full DB, Species DB, Published DB, and Full Length DB . Trace files can be viewed by selecting at least one trace file and clicking on the View Trace Files button. This will open a new window which displays information on the traces and quality scores as well as a graphical representation of the chromatograms. BOLD currently supports a BOLD-LIMS report for samples processed in the Canadian Center for DNA Barcode (CCDB) which provides the user with a report on the progress of a sample, along with details on the protocol used. If a publication is associated with a record, details on the publication title, authors, and source will be available on this page. By selecting the title of the publication, users will be provided with the details of the article, including publication date and abstract where the information is available. Publications are sequence dependent, which means they are directly associated with a specific marker. Comments and annotations can be added to the Sequence Page and the Trace Viewer . By selecting the Add Tags and Comments button, users may choose to use one for the pre-created tags, create a new tag, or add a personal comment. More information on how and why annotate a record can be found here. Edit and Delete Sequences ManuallyNucleotide sequences can now be edited or deleted directly on this page, by users with the adequate permission level. By clicking on Clear Sequence users will be able to remove the full nucleotide sequence from the record; while by clicking on Edit Sequence users will be able to add or remove base pairs in a text box format.
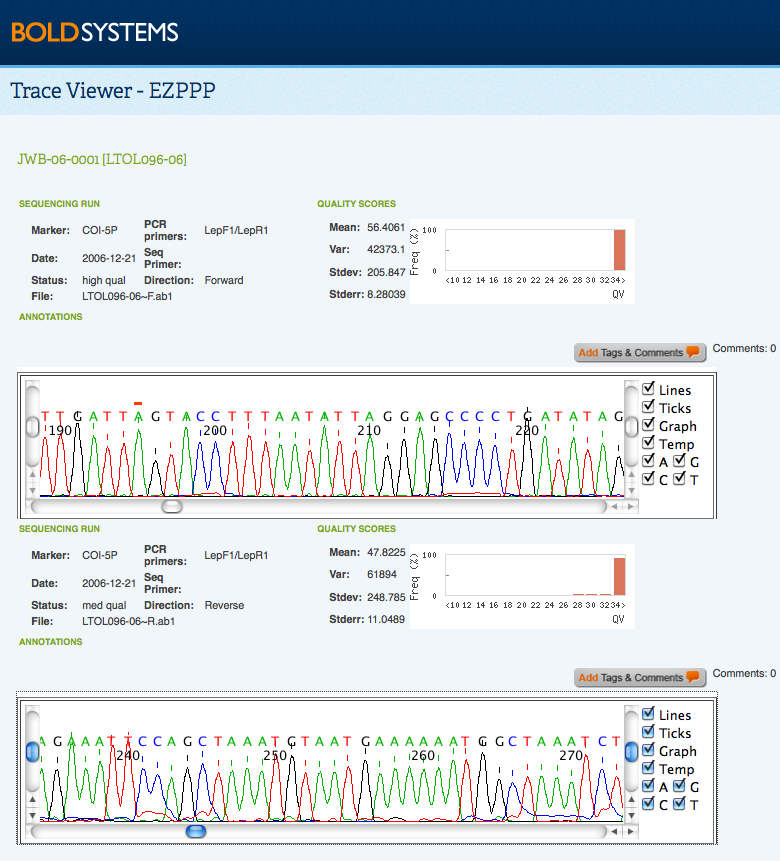
Trace files can be viewed by selecting at least one check box in the Sequence Runs in the Sequence Page. Upon submission, it may take up to 24 hours for users to be able to download or view trace files. By clicking on View Trace Files, a new window will open, which details each trace run along with a graphical representation of the trace's chromatogram. In cases where quality scores for the traces are not provided in the submission package, values will be automatically calculated by BOLD. Summary statistics on the overall quality scores for each trace are included, along with a visual display of individual quality values for each peak. Users can scroll through the chromatograms in order the interpret the intensity and quality of the traces. Every trace is displayed in the original orientation and direction, so that reverse traces are not displayed in the complementary alignment. By selecting View Sequence users may examine the nucleotide sequence for each individual trace.
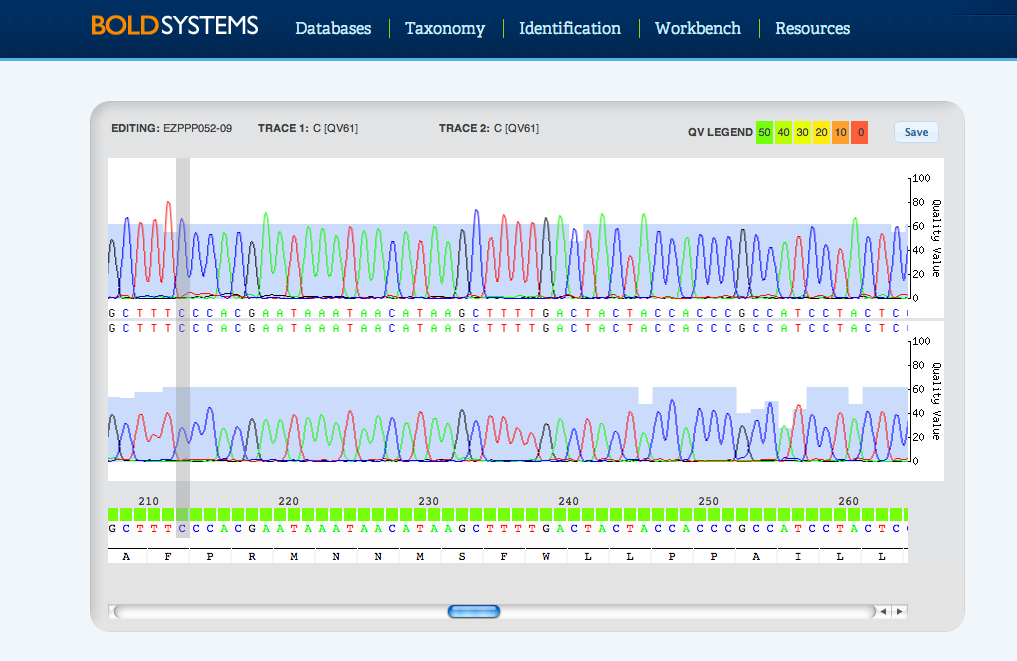
Sequence EditorThe newest version of BOLD introduces a customized, built-in sequence editor. Users now have the ability to view and assemble trace files directly on BOLD. The Sequence Editor tool allows users to call and delete base pairs and then to upload the sequences directly into their records.
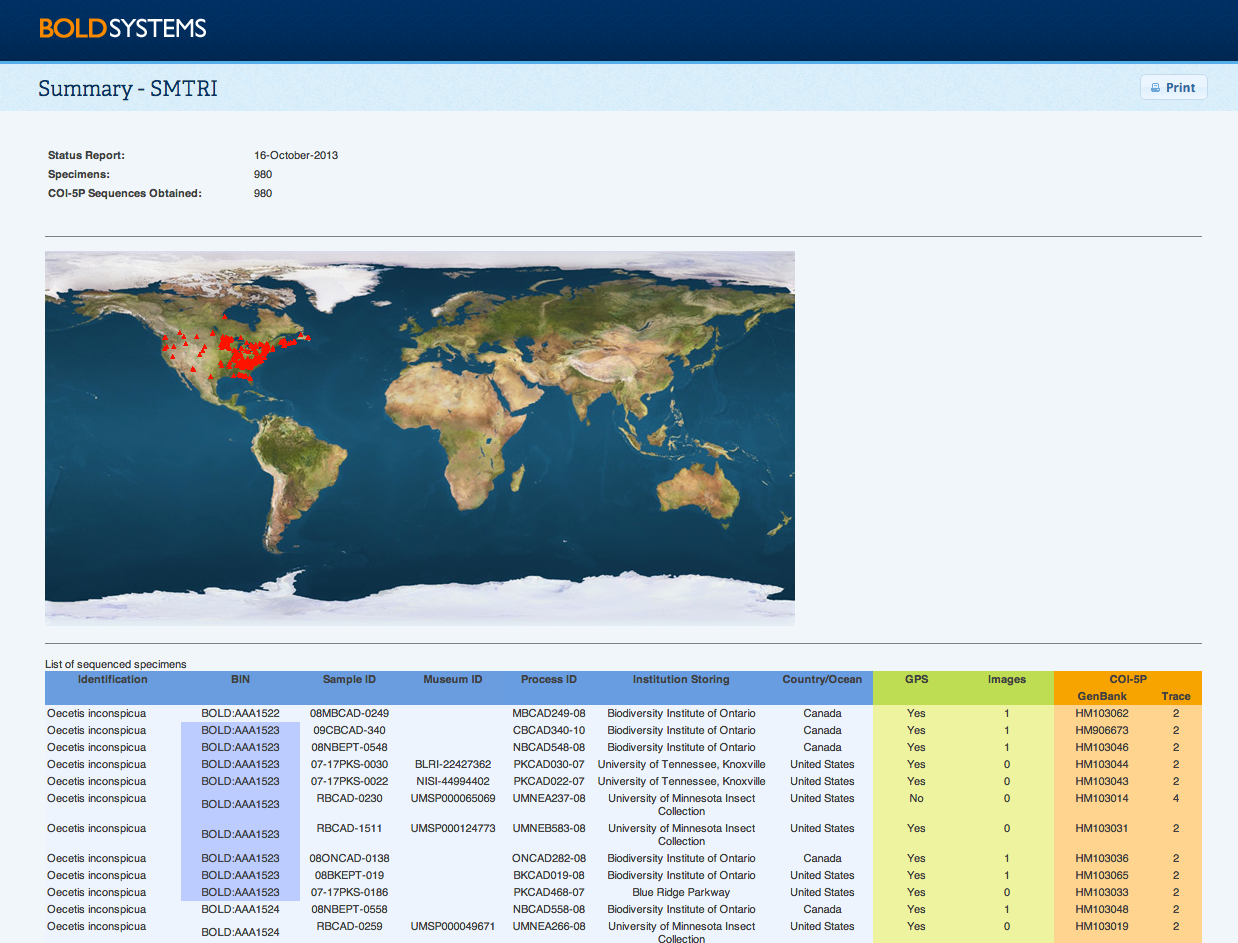
Back to Top Project Summary ReportThe Project Summary Report is found under the publication menu on the Project Console, Dataset Console, and the Record List. The report highlights the summary information for the project or dataset, including the day the report was generated, the number of specimens, and the number of sequences obtained. In addition, it includes a distribution map for the records in the project or dataset. The report also lists basic data on the specimens including provisional identifications, Sample ID, Museum ID, Process ID, storing institution, country/ocean, and state/province. It contains additional details on the presence of GPS points and number of images in the record. Finally it lists the GenBank accessions associated to a record where one exists, and the number of traces uploaded. BIN names added to the Project SummaryBIN names are now also included in the Summary Report to facilitate adding these identifications into publications. BIN names are listed for each record individually, so users can copy the information available on the table and add it directly to their publications.
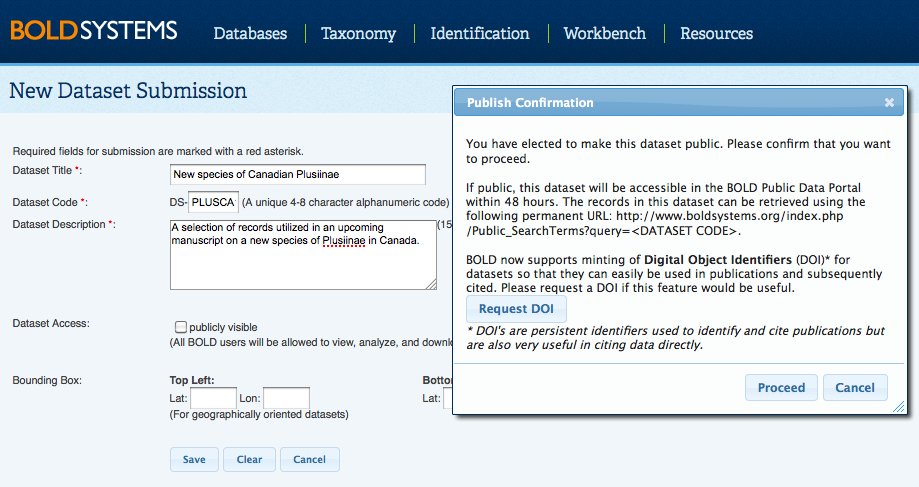
Back to Top Datasets and DOIsDatasets are virtual copies of a set of records that users can create when they want to analyze a subset of records over an extended period of time, submit some, but not all records in a project to GenBank, publish a subset of the data, and request a DOI on their dataset. By creating a dataset, a user has the ability to select records from a variety of projects on BOLD and group them together in one permanent list without having to move the records out of the home projects. For instance, a researcher working on Lepidoptera may want to create a Dataset for one genus due to an upcoming publication on those records, but wishes to leave these records in their home projects. When adding records to a dataset, the actual records remain in the original projects where they can continue to be edited as necessary. Any changes to the actual records will appear simultaneously on the records in the dataset. Creating a new DatasetOnce logged into BOLD, select the New Dataset button in "Your Datasets" section of the User Console. By choosing to make the dataset public, the user is provided with the opportunity to request a DOI, now available via a partnership between BOLD and DataCite. The assigned DOI can be used in manuscripts in place of supplementary tables, and can be referenced when used by others.
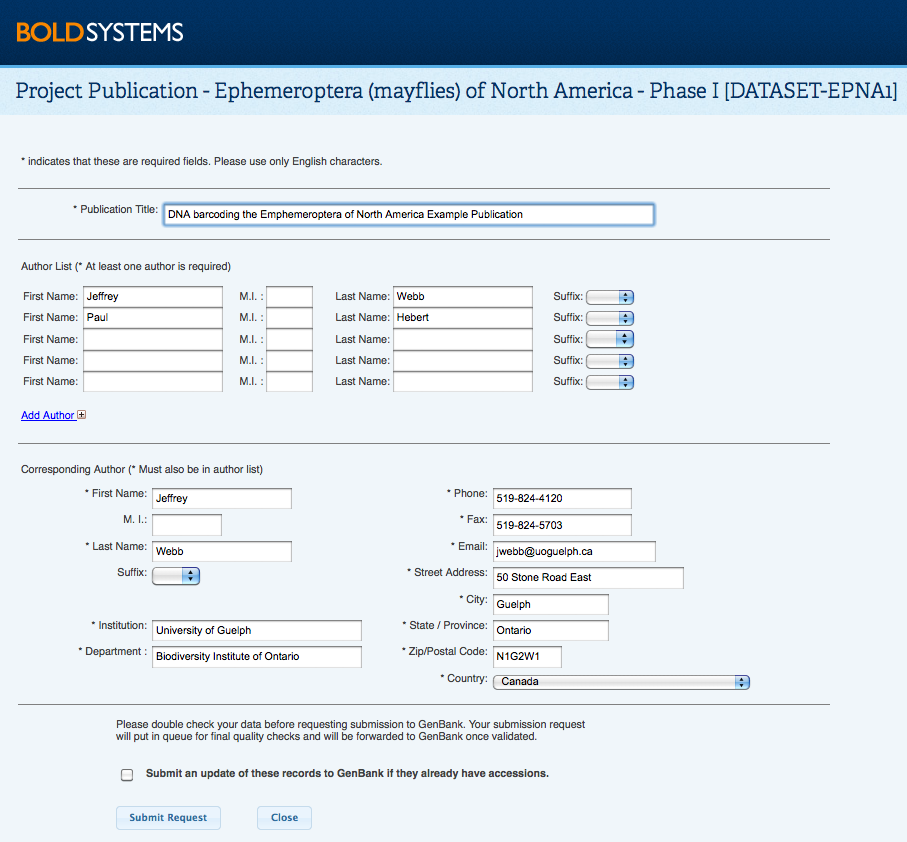
Most of the information provided during the dataset creation can be edited by the dataset manager by clicking on Modify Project Properties from within the Dataset Console. Adding and Removing recordsUsers can add any records they have access to, to a dataset in batches of up to 2,500 records at a time. Datasets can be overlapping, that is, the same record can be utilized in multiple Datasets by multiple users. A single Dataset can contain up to 25,000 records. To remove records from a Dataset, select them from the Record List and click Remove Records from the menu on the left hand side. Back to Top GenBank & BOLD Public data submissionsBOLD shares a tightly integrated data exchange pipeline with NCBI (GenBank) that allows for automatic submission of data to GenBank. Users are only required to fill in the author and publication information, which is sent to GenBank along with the specimen, sequence, and trace data (only for COI gene) which has been transformed to the required formats. GenBank responds directly to the user with the accessions for their records to be included in publications. Accessions are also sent to BOLD to ensure bidirectional linkage. The data exchange pipeline is further utilized to send GenBank updates to records. Identifications of records submitted through BOLD to GenBank can still be refined and updated as new information is obtained. Changes to the taxonomy of BOLD records are automatically sent to GenBank so that GenBank can gain up to date information. How to submit records from BOLD to GenBankBOLD has a simplified submission tool for Project Managers to submit sequences along with trace files to GenBank. Within the Project or Dataset Console, click on Submit to Genbank. Please note that only a project or dataset manager has access to this function. If only a subset of records need to go to GenBank, then the relevant records can be submitted via a Dataset. After submission of the form, the project or dataset will be reviewed by the BOLD staff to make sure the data meet the requirements for GenBank. The accession numbers are returned by email from GenBank to the project manager, and are associated with the records on BOLD for quick reference in the Project Summary form. GenBank accessions will appear wherever the matching sequence appear on BOLD, and will provide direct links to the GenBank page for that sequence. GenBank puts a default 1 year privacy period on records submitted through BOLD, where the records are deposited in GenBank but are still inaccessible to the public. This privacy period allows BOLD users to gain accessions early in the manuscript writing process and removes the need for rushing to gain accessions once the manuscript is in its final stages of acceptance by a journal.
Steps after publication
Contact the BOLD support team through [email protected] with questions on any aspect of the publication process. Back to Top |

